Display Fn runtime metrics using Prometheus and Grafana
This tutorial is based on Nigel Deakin’s “Announcing Prometheus Metrics from Fn” blog post.
The Fn server exposes metrics i.e. information about it’s performance and resource consumption. This information can be easily made available to monitoring tools to display and analyze the server performance. In this tutorial we will use popular monitoring tools Grafana and Prometheus to visualize Fn server metrics.
Before you begin
- Make sure you have cloned the GitHub repo
fnproject/tutorials. - Make sure you are in the folder
<checked-out-dir>/tutorials/grafanawhile executing the commands below. - Make sure you have Docker 17.10 or later installed and running.
- Make sure you have
fnCLI tool installed. If you don’t havefninstalled, follow the instructions to download and install Fn. - Make sure you have
Fn serverup and running. If it’s not running, follow the instructions to start the Fn server.
As you make your way through this tutorial, look out for this icon
. Whenever you see it, it’s time for you to perform an action.
Fn server metrics
Currently Fn provides three sets of metrics. We’ll see all three sets of metrics in action later.
- Function counts: the number of functions that are currently queued or are running, and the number of functions that have completed successfully or failed since the server was last started
- Operation durations: these represent the time taken to perform various operations. In addition to obtaining the time taken to execute a function, you can also obtain finer-grained data such as the time taken to start the docker container in which it runs
- Docker metrics: when Fn executes a function in a Docker container it obtains various statistics from that container, such as CPU and memory usage, and makes them available as Prometheus metrics
Fn server makes metrics available using the API endpoint /metrics by default. Although this endpoint is intended for use only by Prometheus, you can invoke it yourself to see how it works.
So far we have seen the raw metrics data generated by Fn server. Now let’s see how to feed this data to Prometheus and then visualize the data using Grafana.
Introducing Prometheus
Prometheus is a popular open-source systems monitoring tool. It is a server process which scrapes metrics data from servers and makes it available via a query API. It polls the Fn metrics endpoint at periodic intervals and saves the values of each metric in a database. If you’re running multiple Fn servers you can configure Prometheus to scrape them all in turn and combine the data together.
Prometheus has a powerful API and query syntax which can be used to obtain values of these metrics. You can obtain historical values of a metric, suitable for displaying on a graph, or you can perform statistical operations such as summing metric values across multiple labels, calculating rates and performing quantile functions. Prometheus also has a web interface which allows you to see what metrics are available, and try out ad-hoc queries.
Start Prometheus
Open a terminal window and navigate to the directory containing this example.
cd <checked-out-dir>/tutorials/grafana
Download the prometheus.yml from fn/examples/grafana
curl -L0 https://raw.githubusercontent.com/fnproject/fn/master/examples/grafana/prometheus.yml > prometheus.yml
Examine the provided Prometheus configuration file:
cat prometheus.yml
This shows the contents of prometheus.yml file
  global:
    scrape_interval:     15s # By default, scrape targets every 15 seconds.

    # Attach these labels to any time series or alerts when communicating with
    # external systems (federation, remote storage, Alertmanager).
    external_labels:
      monitor: 'fn-monitor'

  # A scrape configuration containing exactly one endpoint to scrape:
  # Here it's the Fn server
  scrape_configs:
    # The job name is added as a label `job=<job_name>` to any timeseries scraped from this config.
    - job_name: 'functions'

      # Override the global default and scrape targets from this job every 5 seconds.
      scrape_interval: 5s

      static_configs:
        # Specify all the Fn servers from which metrics will be scraped
        - targets: ['fnserver:8080'] # Uses /metrics by default
The last line ` - targets: … ` specifies the host name and port of the Fn server from which metrics will be obtained. The name fnserver used in this example is defined below in the docker command to start Prometheus server. If you are running a cluster of Fn servers then you can specify them all here.
Check the output of the following docker command. This is used in subsequent docker commands to map the docker IP address to the hostnames fnserver and prometheus.
docker network ls
For Podman
docker network inspect <network name> -f "{{range .Subnets}}{{.Gateway}}{{end}}"
For Docker
docker network inspect <network name> -f "{{range .IPAM.Config}}{{.Gateway}}{{end}}"
This should show an IP address like the following:
172.17.0.1
Now start Prometheus, specifying the above config file.
docker run --rm --name=prometheus -d -p 9090:9090
 -v `pwd`/prometheus.yml:/etc/prometheus/prometheus.yml
 --add-host="fnserver:<gateway IP>" prom/prometheus
Note: This command uses the parameter --add-host to define a hostname fnserver in the docker container and configure it to use the IP address on which the Fn server is listening.
Go to the Prometheus web console in a browser window:
Open a browser and go to http://localhost:9090/graph
While Prometheus can display tables and graphs of metrics data, it is usually used in conjunction with another popular data visualization tool called Grafana.
Introducing Grafana
Grafana is a popular open source data visualization tool. It is another server process. It has a web interface to create custom dashboards that pull data from Prometheus (using the full power of the Prometheus query API to perform statistical transformations), display multiple metrics using graphical dashboards and can also generate alerts.
Grafana provides powerful and flexible facilities to create graphs of any metric available to Prometheus. This example provides a ready-made dashboard that displays the numbers of functions that are queued, running, completed and failed.
Fn comes with a number of pre-defined dashboards which showcase the various metrics provided by the Fn server.
Start Grafana
From the same terminal window and the same directory as above, start Grafana on port 5000:
docker run --name=grafana -d -p 5000:3000
--add-host="prometheus:<gateway IP>" grafana/grafana
Go to the Grafana web console in a browser window:
Open a browser and go to http://localhost:5000
Login using the default Grafana credentials:
Enter user:
adminand password:admin
Configure Grafana to pull metrics from Prometheus
Create a datasource to obtain metrics from Prometheus:
- Click on Add data source
In the form that opens:
- Set Name to
PromDS- Set Type to
Prometheus- Set URL to
http://<your host IP address>:9090- Click Add
- Click Save and test
Dashboard 1: Function Count Metrics
The Fn usage dashboard demonstrates the first type of metric provided by Fn server: function counts.
In the folder <checked-out-dir>/tutorials/grafana, download the fn_grafana_dashboard.json from fn/examples/grafana
curl -L0 https://raw.githubusercontent.com/fnproject/fn/master/examples/grafana/fn_grafana_dashboard.json > fn_grafana_dashboard.json
Import the dashboard that displays metrics from the Fn server:
- Go to http://localhost:5000/dashboard/import
- Click Upload .json file on the top right hand side of the screen and select the file
fn_grafana_dashboard.jsonfrom the folder<checked-out-dir>/tutorials/grafana- Select the Prometheus data source
PromDScreated above- Click Import
You should then see the Fn usage Grafana dashboard showing Function counts: queued, running, completed, failed. Now invoke some function a number of times and see the graphs update. We have provided a sample function in the folder <checked-out-dir>/tutorials/grafana/myfunc.
Change directory:
cd myfunc
Now build and deploy the function:
fn deploy --local --app myapp
We have provided a simple script file ‘run.bash’ in the folder <checked-out-dir>/tutorials/grafana/myfunc. This script invokes our function 100 times.
bash run.bash
Let it run whilst you watch the graphs update. You will see something like this:
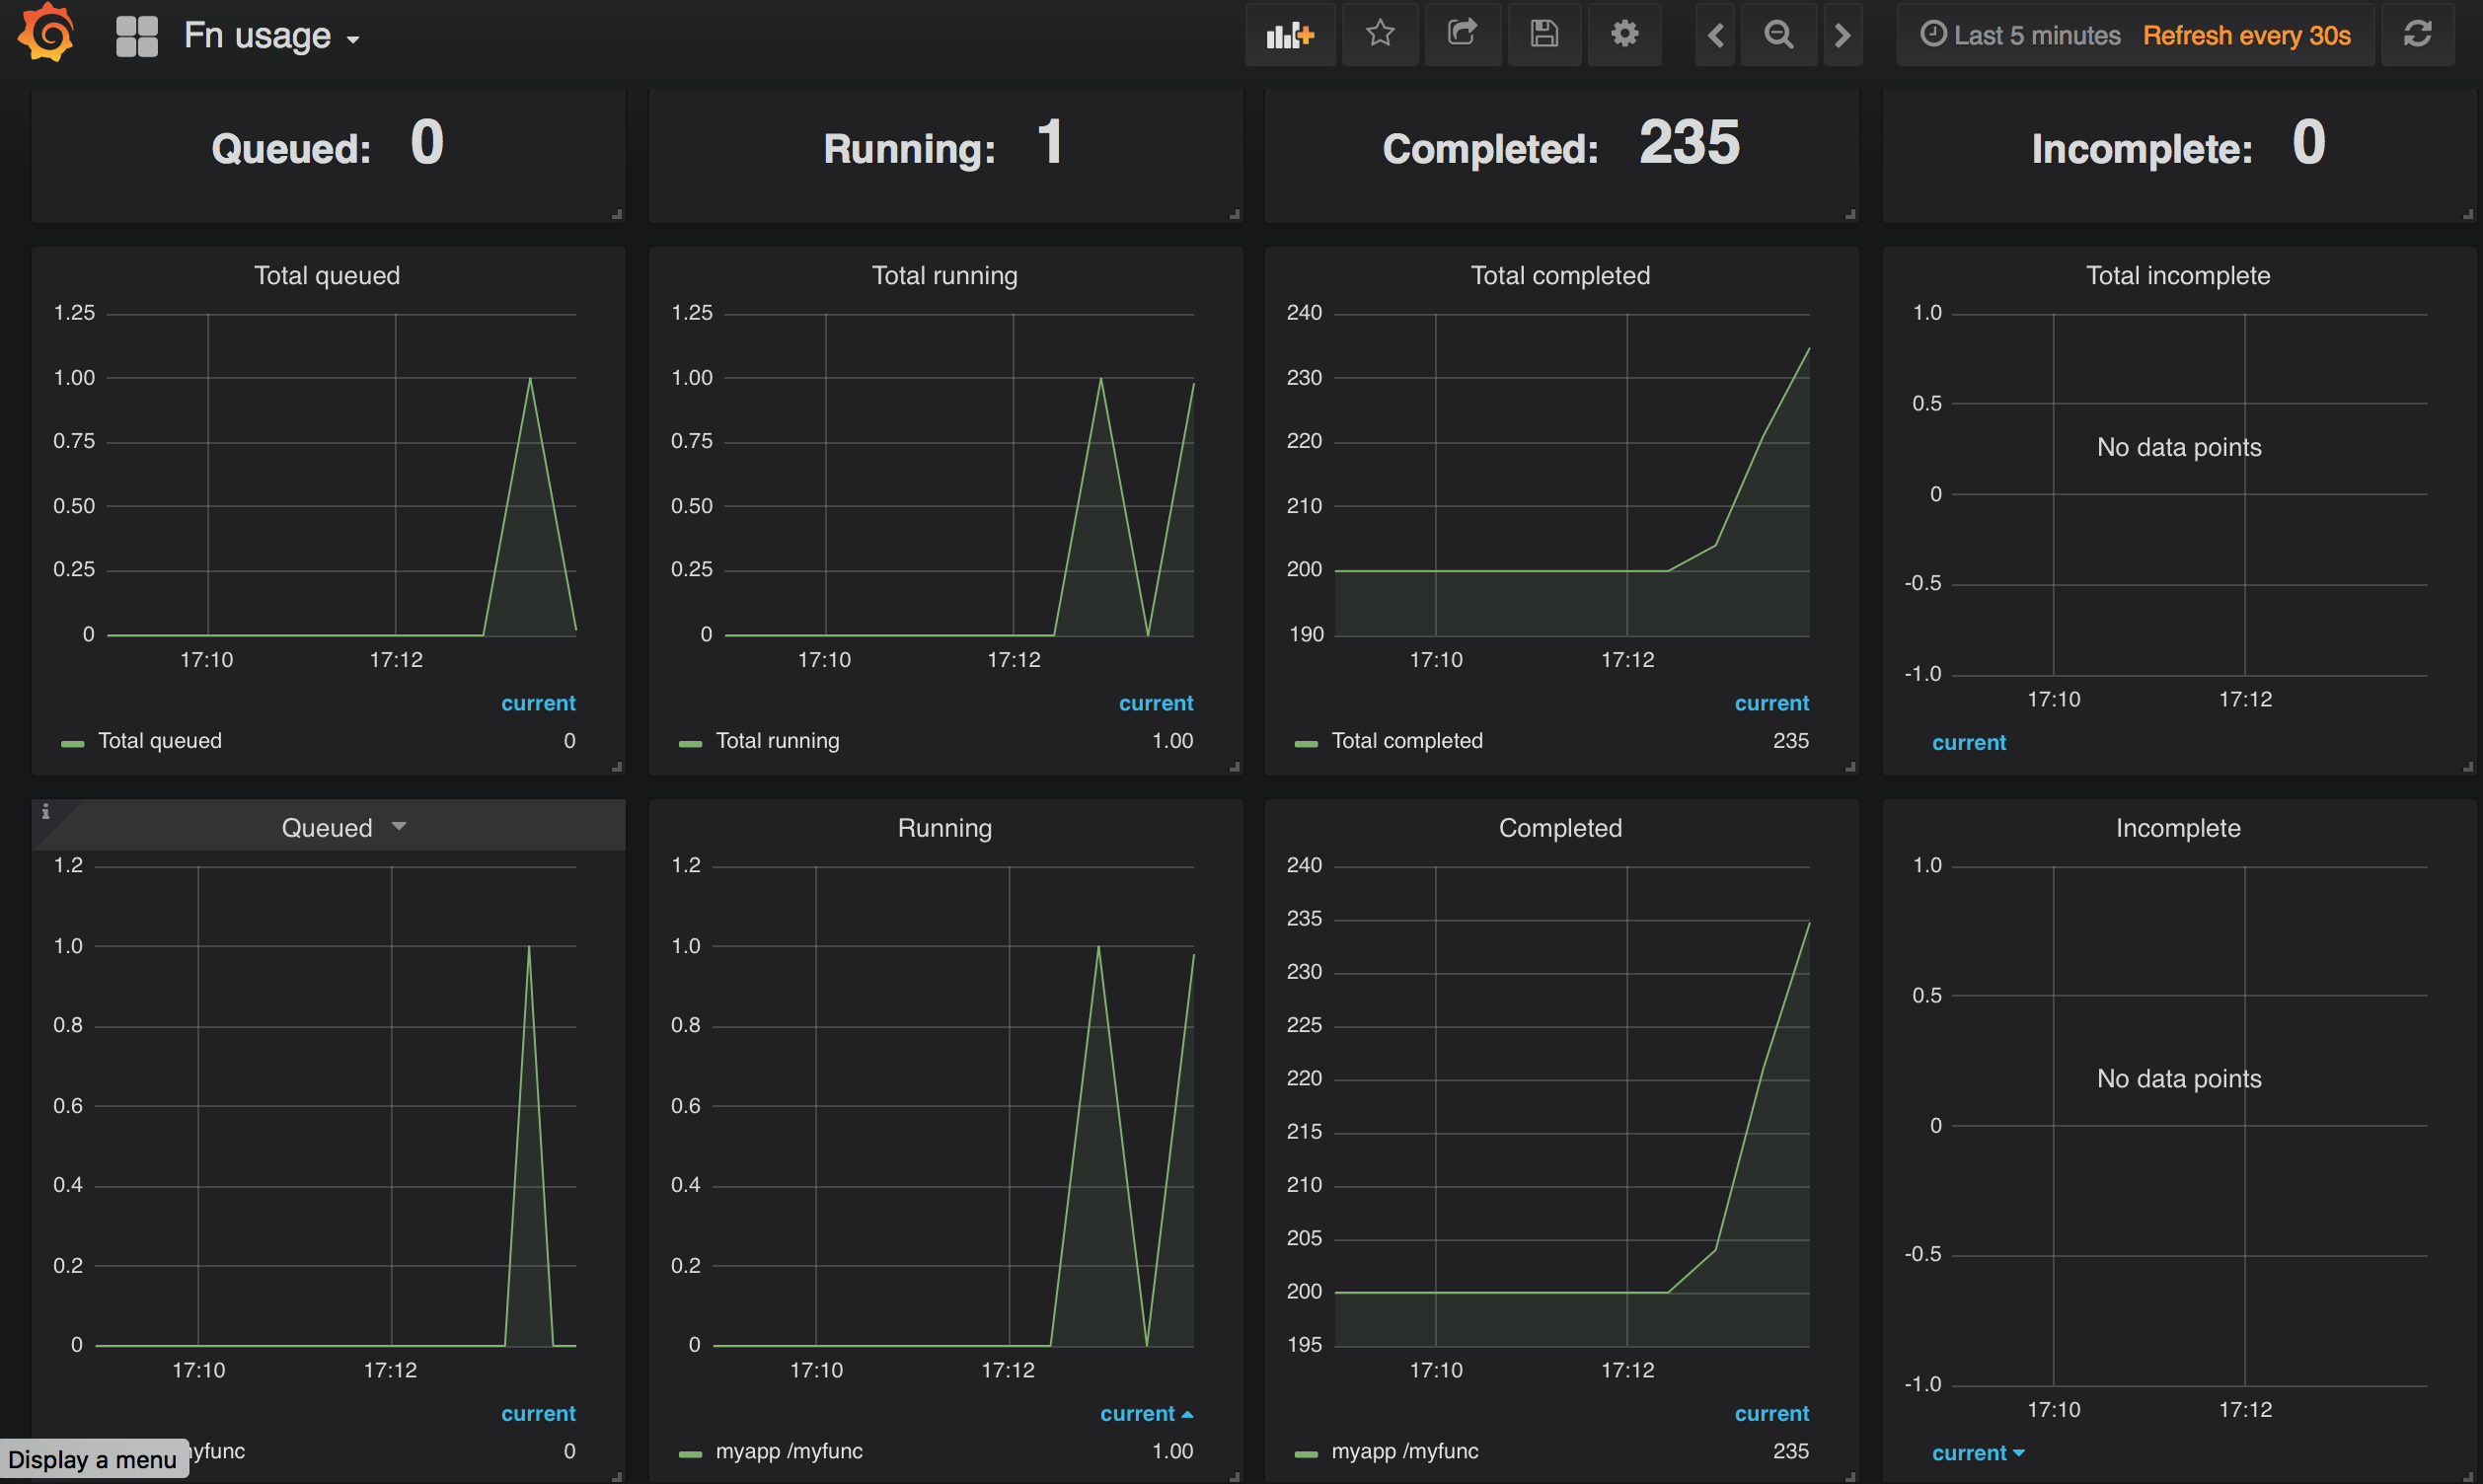
This dashboard shows the four “function count” metrics. From left to right, these are:
fn_queuednumber of async function calls that are queuedfn_runningnumber of function calls that are currently runningfn_completednumber of function calls that have completed successfullyfn_failednumber of function calls that have failed
For each type of metric, the dashboard displays two separate graphs, one above the other:
- The graph at the bottom shows the raw data, which by default is subdivided by its app and trigger (path) labels. So you will see one line for each function
- The graph at the top shows the result of performing a Prometheus
sumexpression that adds together the metric values for each function. So the graph shows just one line, the grand total for all functions
This demonstrates how there is more to using Prometheus than simply displaying a metric. It allows you to perform various statistical transformations on the raw data, performing a sum in this case.
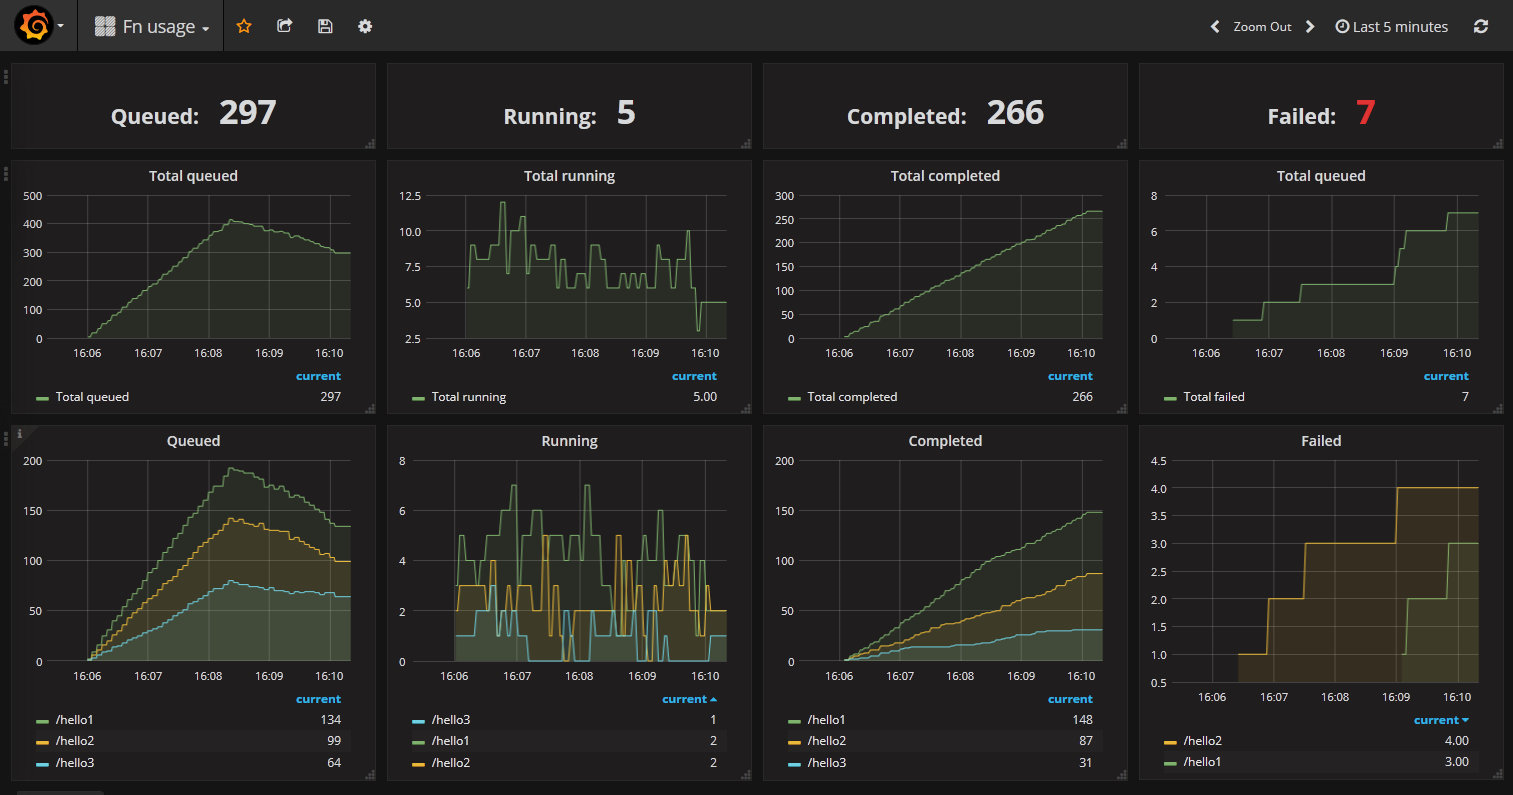
Below is a sample Fn usage Grafana Dashboard showing multiple functions over a longer time duration:
Dashboard 3: Docker Statistics Metrics
The Fn docker stats dashboard demonstrates the third type of Prometheus metric provided by Fn server: docker statistics.
In the folder <checked-out-dir>/tutorials/grafana, download the fn_grafana_dashboard3.json from fn/examples/grafana
curl -L0 https://raw.githubusercontent.com/fnproject/fn/master/examples/grafana/fn_grafana_dashboard3.json > fn_grafana_dashboard3.json
Import this dashboard in Grafana:
- Go to http://localhost:5000/dashboard/import
- Click Upload .json file on the top right hand side of the screen and select the file
fn_grafana_dashboard3.jsonfrom the the folder<checked-out-dir>/tutorials/grafana- Specify the Prometheus data source
PromDScreated above- Click Import
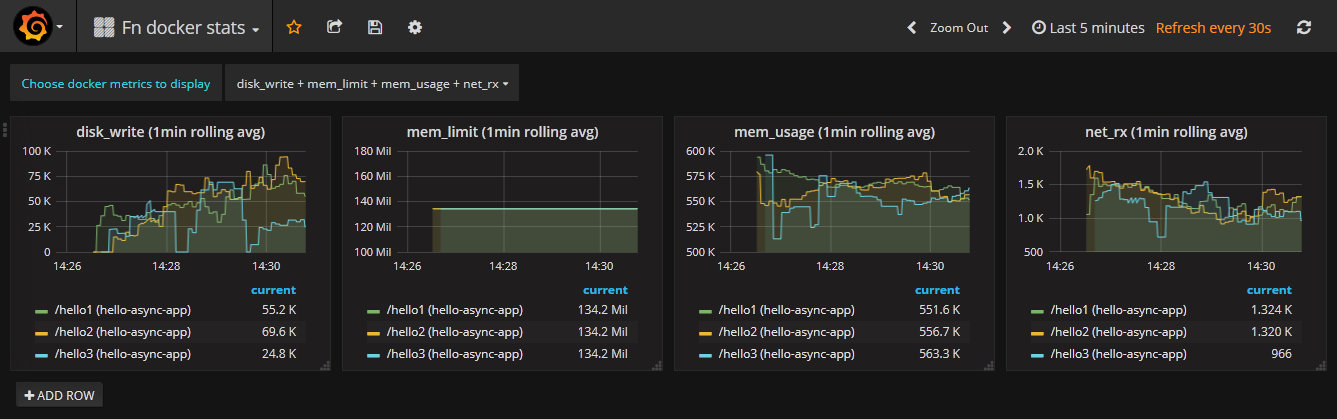
You should then see the Fn docker stats Grafana dashboard showing Docker statistics. Once again when you first display this dashboard it will display just one graph. Use the pull-down list at the top to select which particular docker stats metrics you desire.
To view the available Fn docker stats metrics:
curl --silent http://localhost:8080/metrics | grep 'fn_docker_stats'
And you will see the following metrics:
fn_docker_stats_fn_cpu_kernelfn_docker_stats_fn_cpu_totalfn_docker_stats_fn_cpu_userfn_docker_stats_fn_disk_readfn_docker_stats_fn_disk_writefn_docker_stats_fn_mem_limitfn_docker_stats_fn_mem_usagefn_docker_stats_fn_net_rxfn_docker_stats_fn_net_tx
Note: In the Grafana dashboard we strip out the prefix fn_docker_stats from the metric name. This behaviour is defined in the dashboard JSON file.
Now run the script file ‘run.bash’ in the folder <checked-out-dir>/tutorials/grafana/myfunc. This script invokes our function 100 times.
bash run.bash
Let it run while you watch the graphs update. All the metrics have the labels fn_path and fn_appname set to the trigger/path and application e.g. /myfunc (myapp) in the legend below each graph. You will see something like the following:
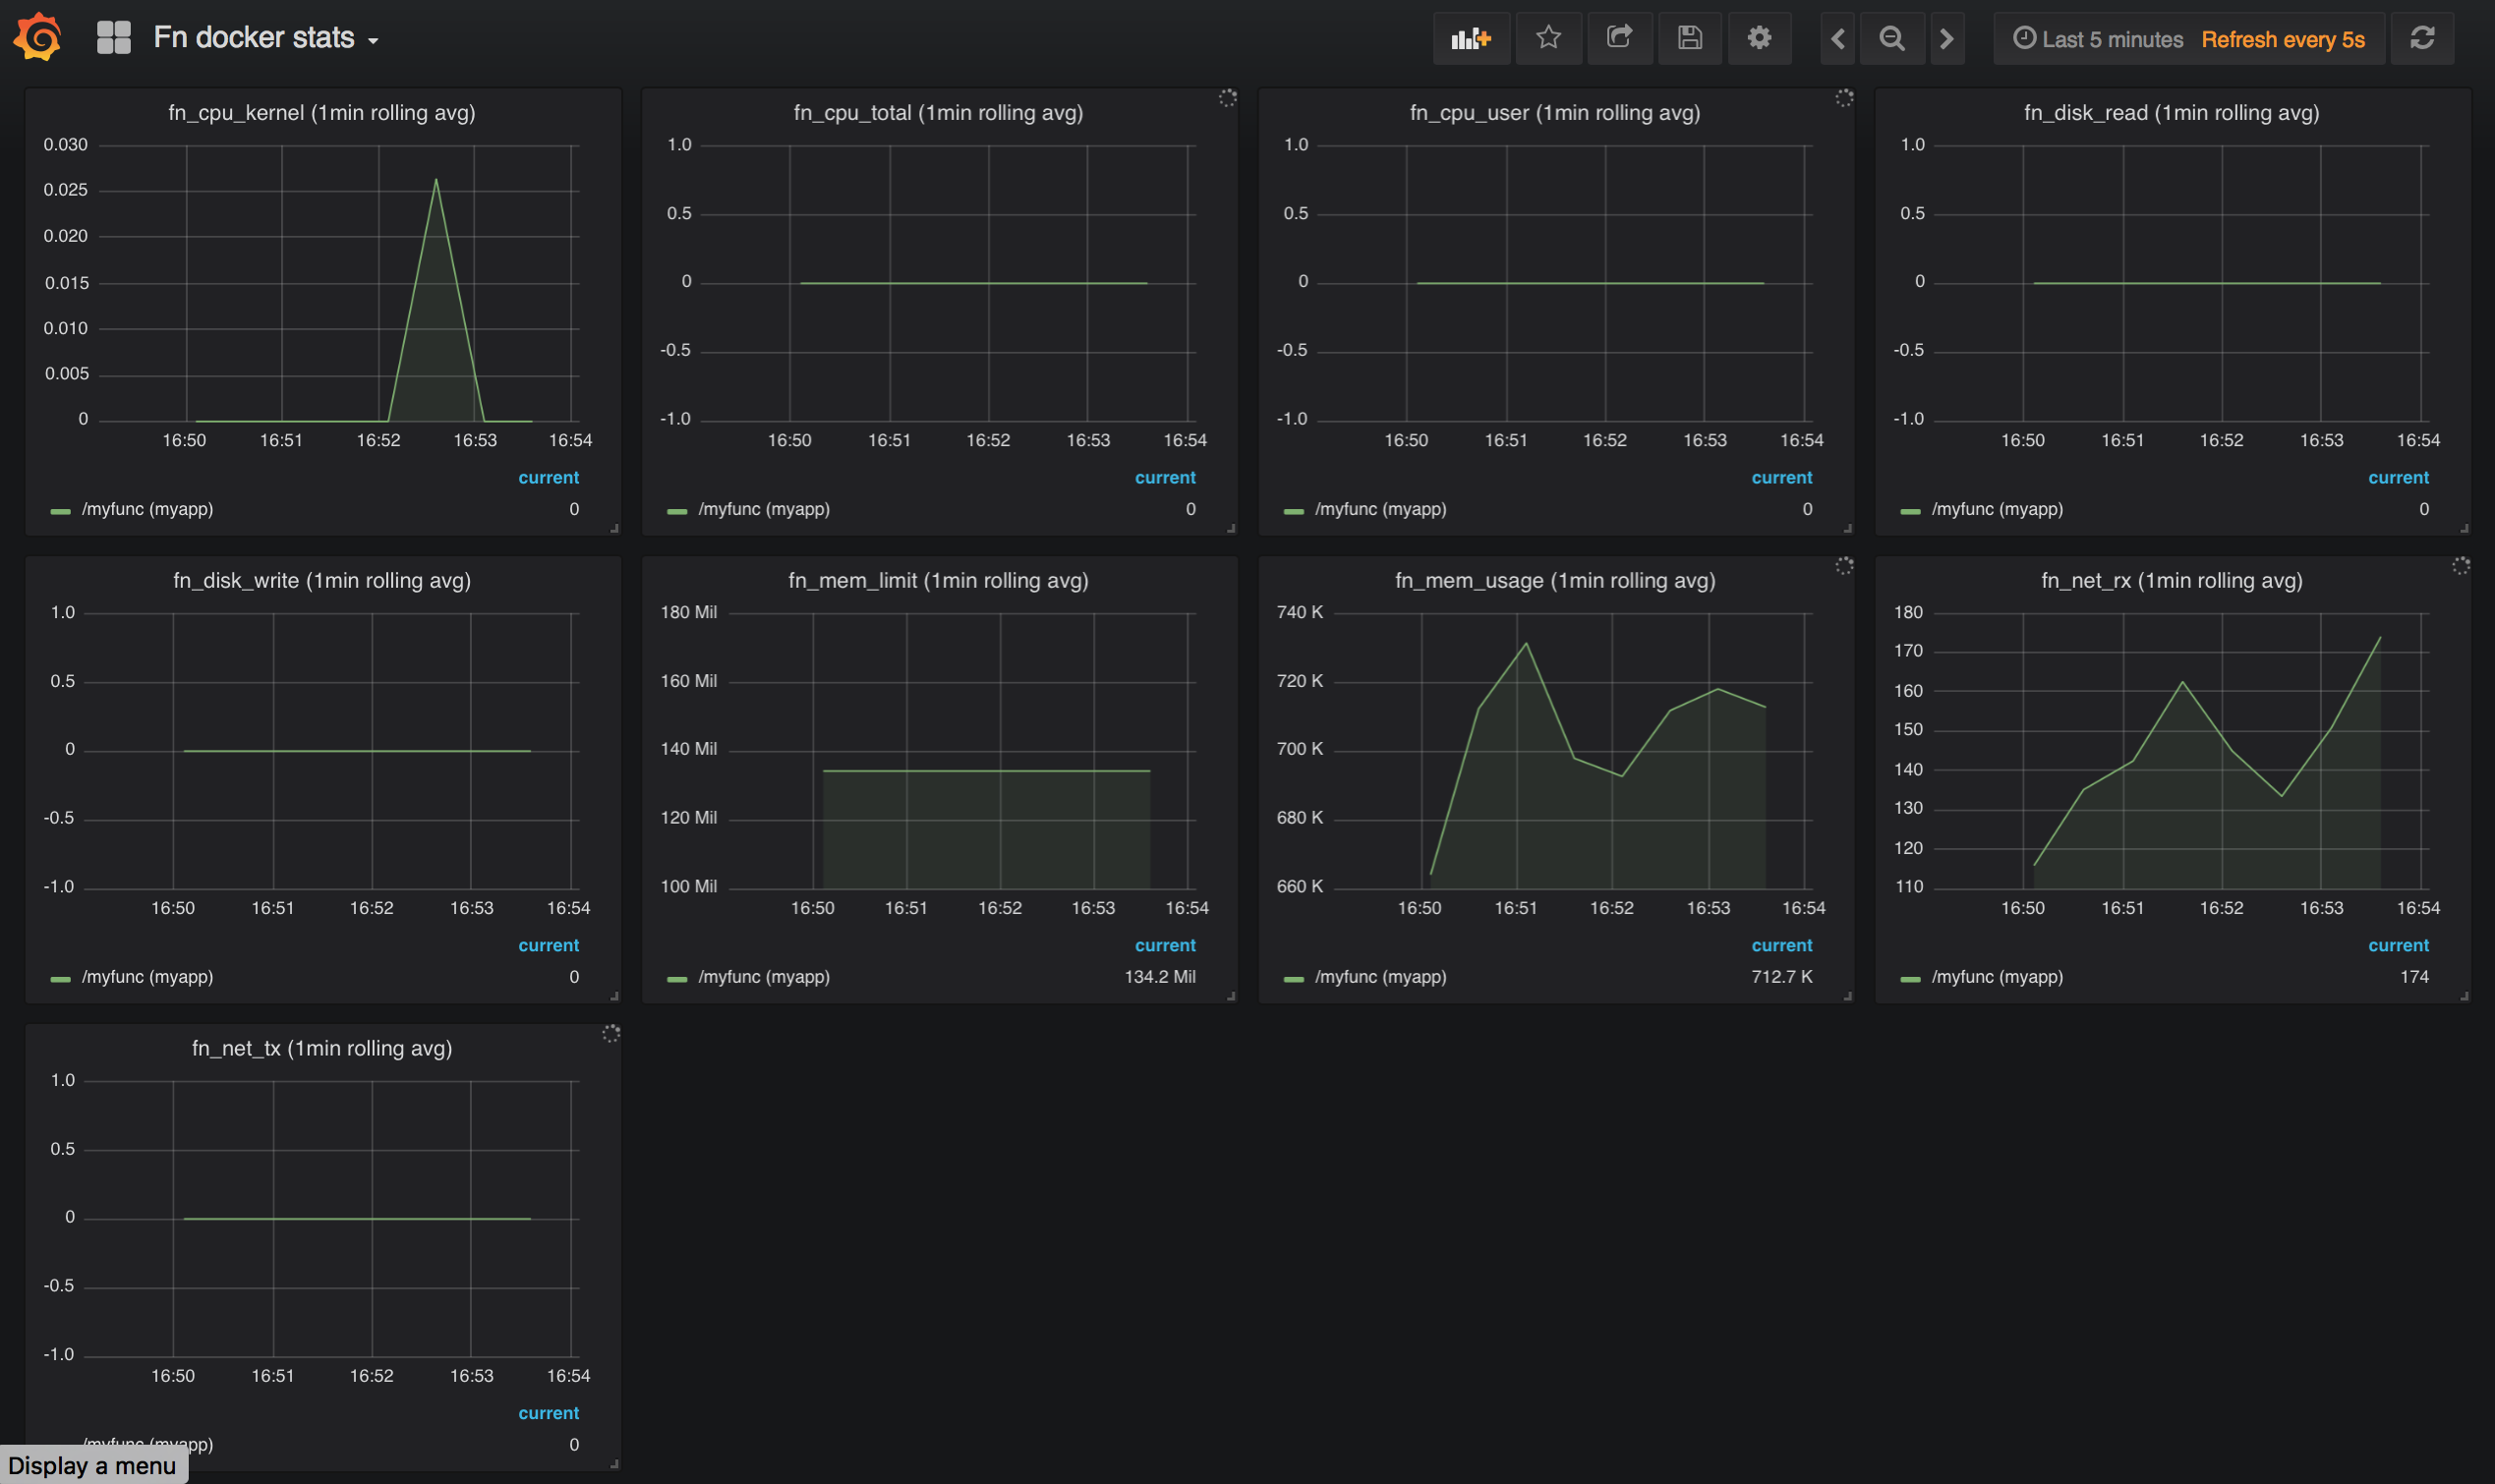
Note: If the container runs for a very short time there may be insufficient time to obtain statistics before the container terminates. So you may not see any metrics if your function is very quick and hence gives docker insufficient time to obtain the statistics before the container running your function shuts down.
Below is a sample Fn docker stats Grafana Dashboard showing multiple functions over a longer time duration:
Summary
Congratulations! You have a working set up of Fn Grafana dashboards integrated with Prometheus and Fn server metrics. You can leave the setup running and keep checking the dashboards as you work on other tutorials.
Learn more
- Check the Grafana documentation to create your own custom dashboards to display the data that is important to you
- If you enable tracing in the Fn server you can analyze these tracing spans using Zipkin. The same tracing spans are also used to generate duration metrics for Prometheus
Note on this Tutorial
Because of output formatting issues involving Jekyll all instances of double curly braces have been replaced with HTML character entities. (e.g., ‘{{ example }}). The original command is available as an HTML comment immediately after the example in the source for the page.
Go: Back to Contents and proceed to the next tutorial.